|
|
Arduino MKR GSM 1400 |
x 1 | |
|
|
GSM Antenna (comes with the MKR GSM) |
x 1 | |
|
|
DFRobot Heartrate sensor |
x 1 | |
|
|
IR Temperature sensor |
x 1 | |
|
|
3.7v LiPo battery (I used 1,800mAh) |
x 1 | |
|
|
Hologram sim card |
x 1 |
|
|
Arduino IDE |
|
|
|
Hologram |
|

|
Microsoft Azure |
|

|
Microsoft Power Bi |
|

|
3D Printer (generic) |
SmartWristband
Abstract
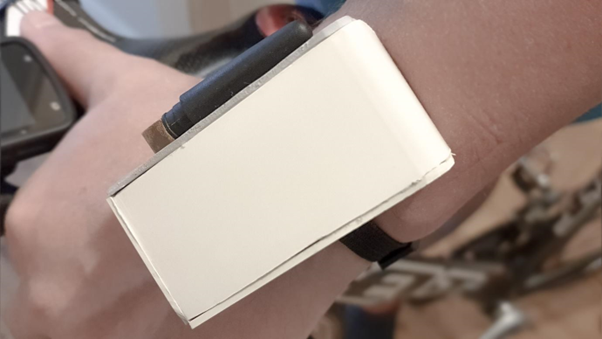
Figure 1: The SmartWristband device being worn
Monitor patients sent to self-isolate with the coronavirus by collecting their temperature and heart rate through a comfortable wristband and sending this data to the hospital through an interactive dashboard and ensure that they respect the isolation by alerting appropriate authorities if the user leaves their home.
I decided to create a solution that would help care for people which have contracted a weak form of the virus. This is a category of patients which is often overlooked as their symptoms are not serious to warrant very close surveillance. However, this does not mean that their condition isn’t volatile. Due to this fact, I believe that monitoring the health of these patients is a priority.
As it turns out, countries have different approaches for tending to these patients: some will hospitalise them (crowding hospitals with patients that could be monitored off-campus), while others send them to self-isolate at home. But there is a problem with the second option: a patient’s condition can quickly deteriorate. As a result, all patients must be monitored.
Sure, there exists heavy, bulky equipment that does this. But the problems are obvious; as the majority of the sick population will exert weak forms of the virus, these expensive, uncomfortable devices do not have the capacity to scale and be deployed to the entire population.
There are also situations in which patients who exhibit symptoms may grow restless and wish to leave their home, putting themselves and others at risk. So that this does not occur, the condition and status of patients should be monitored.
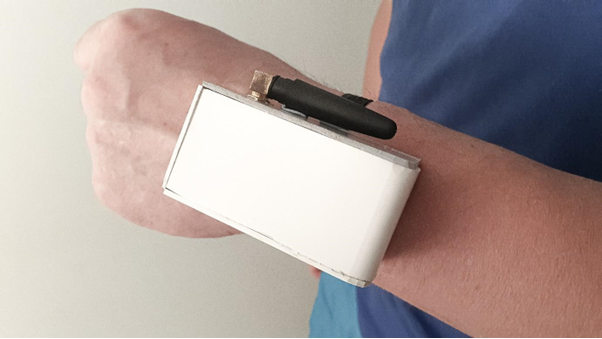
Figure 2: The SmartWristband device being worn
SmartWristband is a wristband held device that monitors the patient’s vitals and geolocation, caring for their safety while they fight the virus within the constraints of their home. The device is powered by an Arduino MKR GSM 1400 and is equipped with both an IR temperature and heart rate sensor collecting crucial information about the patient’s health. Elevated temperature and irregular heart rate are signs of the progression of the virus. The patient will not notice these changes immediately, SmartWristband aims to do this and stream the data live and securely to the hospital monitoring the patient.
The device will also track the user’s location ensuring that they are at home at all times. All of this data is centralised in a scalable database allowing for thousands of these devices to be deployed internationally.

Figure 3: The dashboard detailing the heart rate, temperature, location and other parameters for a specific patient
The hospital will have access to a dashboard where they will be able to see the health of all the patients being monitored at a glimpse as well as a specific report going into the detailed state of each patient.
Machine learning algorithms are also implemented in the application to predict the temperature and heart rate of the patient in the near future so that the hospital knows what to expect and when to hospitalise the patient.
The patient also has access to a mobile dashboard showing them their heart rate and temperature as well as when they will need to charge their wristband.
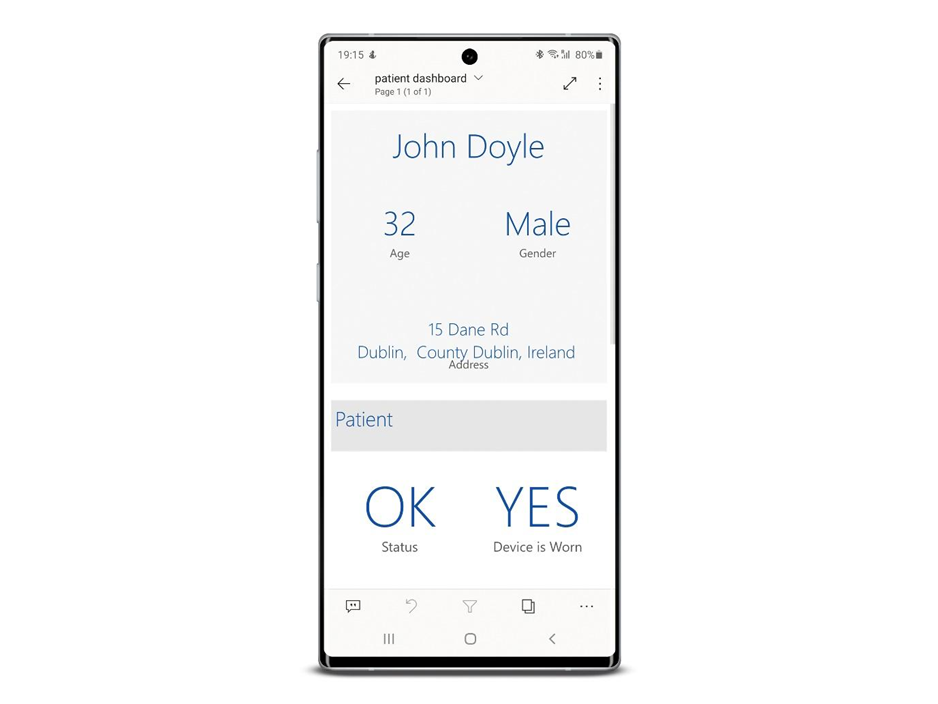
Figure 4: The mobile dashboard available to the patient displaying data collected by the device
The device is comfortable enough for the patient to wear day and night without noticing it. SmartWristband will also notice if the user took the device off, alerting the hospital in this case.
SmartWristband is a low-cost, scalable, open source solution for caring for patients sent to self-isolate with weak forms of the virus monitoring the development of their condition and alerting medical staff through machine learning and a simple-to-use dashboard experience if a patient requires attention.
This way, hospitals can send patients home and monitor them without the need to allocate a lot of human resources. SmartWristband can ensure that these patients are contained at home and are taken care of, helping the world in the fight with the virus.
Project Sumup
This section will look at the functionality of the application and give a high-level understanding of what it is doing.
Data Collected
Data is collected by the device at intervals of 5 minutes. This is done to provide a real-time view of the condition of the patient while using the lowest possible battery consumption. The device collects two types of data: vital and location.
Vital data refers to the heart rate and temperature of the patient while the location data refers to their geolocation.
Application Frontend

Figure 8: The frontend architecture diagram
The diagram above shows the architecture of the application running on the device. These are the steps taken by the device every 5 minutes. The device collects all the data, checks if it is worn by the user and then packages them and sends them to the backend through GSM.
The device also keeps track of the time, it gets the time from a designated server and syncs its onboard RTC to this timestamp when it wakes up for the first time or after it is turned off.
Application Backend

Figure 9: The backend architecture diagram
The data sent by the device is received in the Azure IoT Hub. A stream analytics job extracts this data from the hub at short intervals of time and pushes it into a Cosmos DB database. The patient and doctor Power Bi reports then query this data at intervals of time from the database, run machine learning algorithms built into Power Bi and then display the data. The doctor’s dashboard then collects all patients monitored and provides a brief of their health.
Why is this data collected?
An analysis of the patient’s temperature and heart rate readings can indicate whether their current state is degenerating. Studies show that an irregular heart rate and high temperature are signs of the presence of the virus. If these vital signs degenerate over time (i.e. the temperature rises gradually) this is a sign that the condition of the patient may be worsening. The patient may not realise this until later, but the device will pick these signs up as they appear.
The geolocation data is also collected by the device, this is done to ensure that the patient is staying at home in quarantine and is abiding by the rules of the isolation. Azure checks if the user is at home and will report this on the doctor dashboard.
A look at the device
I created the prototype with comfort in mind. The device is easily placed on the wrist of the patient, either on the left or right hand. It is equipped with a heart rate sensor and IR temperature sensor that stick out at the bottom of the device to touch the skin of the patient.
These sensors provide precise measurements without causing discomfort. Note that for further temperature precision, the sensor should be placed in a location such as the under the arm in a pad.
The device will use the raw data outputted by the heart rate sensor to check if it is being worn by the patient. The sensor will output a very specific pattern of data when it is in contact with skin and hence the lack of this pattern represents the device not being worn.
Battery Life

Figure 5: The patient dashboard highlighting the battery level of the device and the number of hours of battery left
Rigorous testing was conducted to precisely measure the battery life of the device. The device has a total battery life of 8 days with a single charge. This means that if the patient is to be surveyed for two weeks, the battery would have to be recharged once. The battery can be charged while the device is being worn.
Alternatively, data could be collected at intervals of 10 minutes, essentially doubling the device’s battery life as it would be sleeping between reads, consuming very little battery. The remaining battery life as well as the number of hours of battery life left is displayed on the patient and doctor dashboards.
Cost of Development
The cost of development in the case of the project consists of once-off and recurring costs. The cost of development for one device would be €70 including the enclosure. Recurring costs occur in the backend. I am using Hologram as my service provider costing me €5 to send data for 2 weeks per device. The backend costs including data streaming and the database are at €30 for 2 weeks.
The total cost for 100 devices is approximately €7,035. Note that these devices are reusable.
Note that the backend costs are scalable and will be the same regardless of the number of devices deployed. Costs can be dramatically reduced when buying components in bulk and using custom circuits.
The Doctor Dashboard
It is very important for the hospital to be able to monitor the health of these patients sent at home at all times and get alerts if they are not ok. The hospital has access to a dashboard showing the vitals of all patients monitored as well as a specific report for all of them. This allows doctors to be notified if a patient needs assistance and then can look at the patient in more detail to see exactly what the problem is.
The doctor will receive a notification in the form of an email and alert in the dashboard if a patient is not at home, not wearing the device or has irregular temperature and/or heart rate.

Figure 6: Tiles on the doctor dashboard highlighting core data from all patients being monitored
The doctors will also get alerts through emails when a patient’s vitals are abnormal allowing action to be taken immediately.
The report seen in the dashboard is split into 3 sections: the patient (giving details about the vitals), the location (location of the patient and if at home) and the device (battery level, ID). Machine learning is also used to predict the health of the patient in the near future showing the doctor if the patient’s health is getting worse over time.
Patient Dashboard
I think that patients should also be able to access this data to know how they are doing and become self-aware. Both a desktop and mobile experience is available for the patient so they can get their data on the fly.
Note that forecasting and geolocation data is not displayed on the patient’s dashboard because they would not need that information.
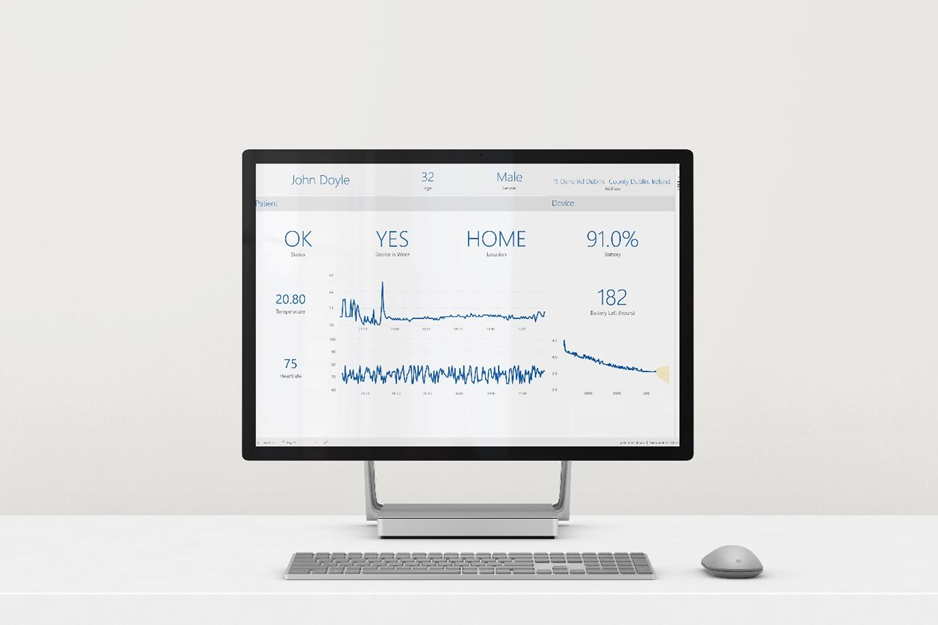
Figure 7: The dashboard the patient has access to on a desktop showing the data collected from the device
Mass Production and Scalability
The device is suitable for mass production and scalable because of its small price point and ease of construction. The device can be operational in any place in the world with cellular coverage protecting people world-wide.
100% Open Source
When developing this project, I ensured that all assets used, libraries and others, were open source to ensure that the application could be developed and released as soon as possible without bureaucracy. This project is fully open source and available on GitHub.
Data Security
The application involves the collection of user location information and its processing. All communications performed between the frontend and backend of the application are encrypted to prevent man-in-the-middle type attacks. Azure IoT Hub is also considered to have state-of-the-art security.
Going Further
While developing this project, numerous ideas to further develop and enhance the product came to mind, this section details them:
- Collection of blood oxygen level can be implemented without the need to change any hardware as this value can be extracted from the existing heart rate sensor. The SpO2 levels in the blood are an indication of the damage done by the virus.
- The development of a 3D printed enclosure would be preferable in a future iteration. The size of the device can also be reduced dramatically making it even more comfortable to wear.
Market Research
Many countries have been implementing alternatives to the monitoring of patients with coronavirus while they self-isolate at home. Taiwan has implemented a revolutionary tracking system where the patients are tracked via their mobile phone to ensure that they stay at home.
Other countries have also implemented ideas to monitor the health of people in self-isolations and some systems work better than others. But no product collects both the vital information about the patient’s state and his/her location in a small, comfortable package.
Target Audience
This device is aimed at people that are sent by the hospital at home to self-isolate because they have been tested positive for a weak form of the virus or are asymptomatic.
Benefits of using SmartWristband
- Ensuring that patients sent to self-isolate are staying at home
- Monitoring the patients’ vitals without the need of them being in hospital
- Liberating space in hospitals for people with severe manifestations of the virus
- Alerting doctors to the state of all patients in self-isolation 25/7
- Providing a comfortable monitoring solution for the patient
- Providing the hospital with a forecast of the patient’s health
- Informing the patient about their health through a mobile and desktop dashboard
- Cost effective and scalable
Project Conduct
This section will guide you through the construction of the project.
Step 1: Getting everything together
The first thing we need to do is get all the components needed together. The components and services needed are listed in the BOM above.
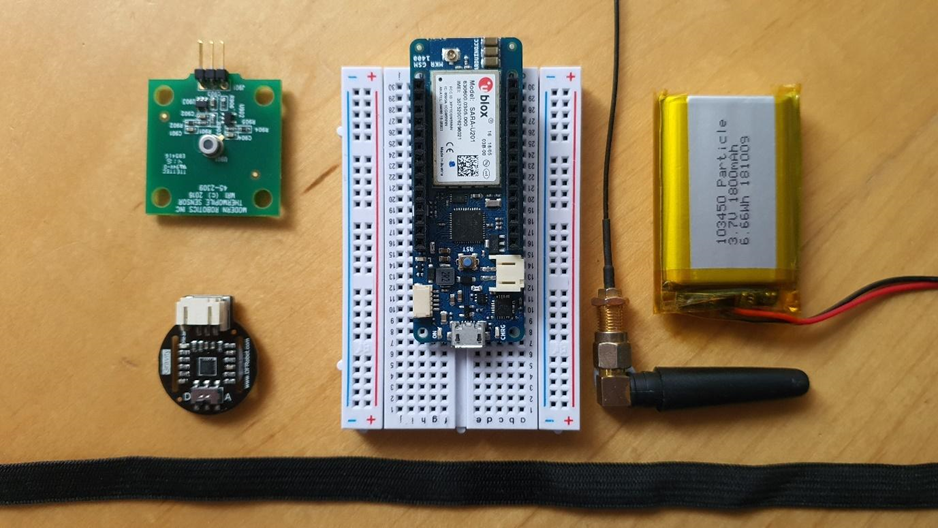
Figure 10: An image depicting all the components required for the project
Use the tutorials linked below to set up the software tools necessary for the project.
- Get the Arduino IDE or use the Web Editor
- Create your Hologram account and connect your SIM card
- Create a Microsoft Azure account
- Create a Power Bi account
Step 2: Working with the MKR GSM
Before we start making the project itself, we need to configure the MKR GSM to connect to Azure IoT. For this, we need to generate and store a certificate on the device to be able to verify the connection with the backend.
There is a tutorial on Hackster that covers this for the MKR NB. Please follow along with this tutorial from the start and note that you should stop after you generated the certificate. Please ensure to save the SHA1 string as we will need it later. The tutorial is here.
Step 3: Connecting everything together
The next thing we must do is get everything wired up. Below is an image depicting the schematics for creating this project. Note that your components probably do not look like the ones in the schematics. Ensure that you connect the temperature sensor to A4 on the device and the heart rate sensor to A5. Don’t forget to put the SIM in!
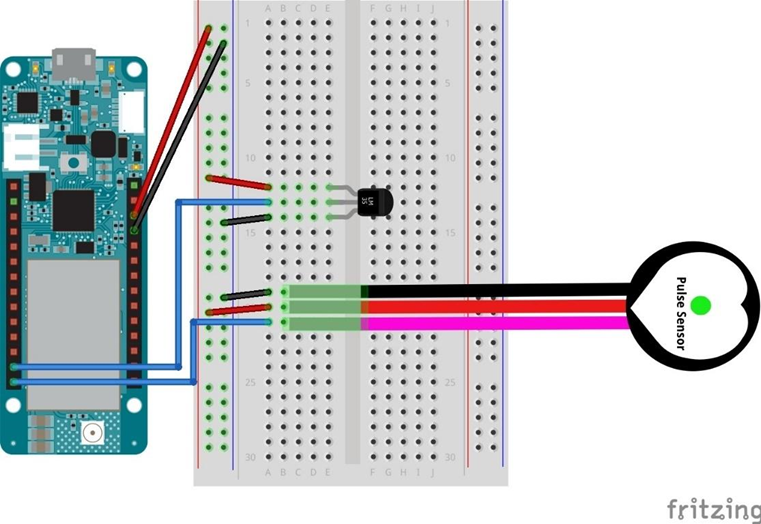
Figure 11: A diagram of the schematics for the SmartWristband device
Step 4: Onto the IoT Hub
Ok, now that we have all of that done, we can move on with preparing the IoT hub. We will be working in the backend for the next few steps to get that out of the way first. Ensure that you have an Azure account before continuing.
- The first thing you need to do is navigate to your console (portal.azure.com) and click on the create a resource button at the top left of the screen. Now type IoT Hub and select the option from the dropdown.
- Click on create after the setup was completed. Note that in this example, we will be using a free tier IoT hub so that we will not be charged for its usage. If deploying this solution, consider changing the tier to S1 (or S2/S3 depending on the scale).
- Create a new resource group and name your IoT hub. Now click on the Size and Scale option from the steps above.
- Now click Review and Create and deploy the resource. Wait for the IoT Hub to create and then open it by clicking onto All Resources from the menu on the right of the screen.
- We now need to create a device and attach it to the IoT hub. Navigate to the IoT Devices option on the menu on the right of the screen and click on the option. Click on the New button to add a new device to the IoT hub. Input the following credentials:
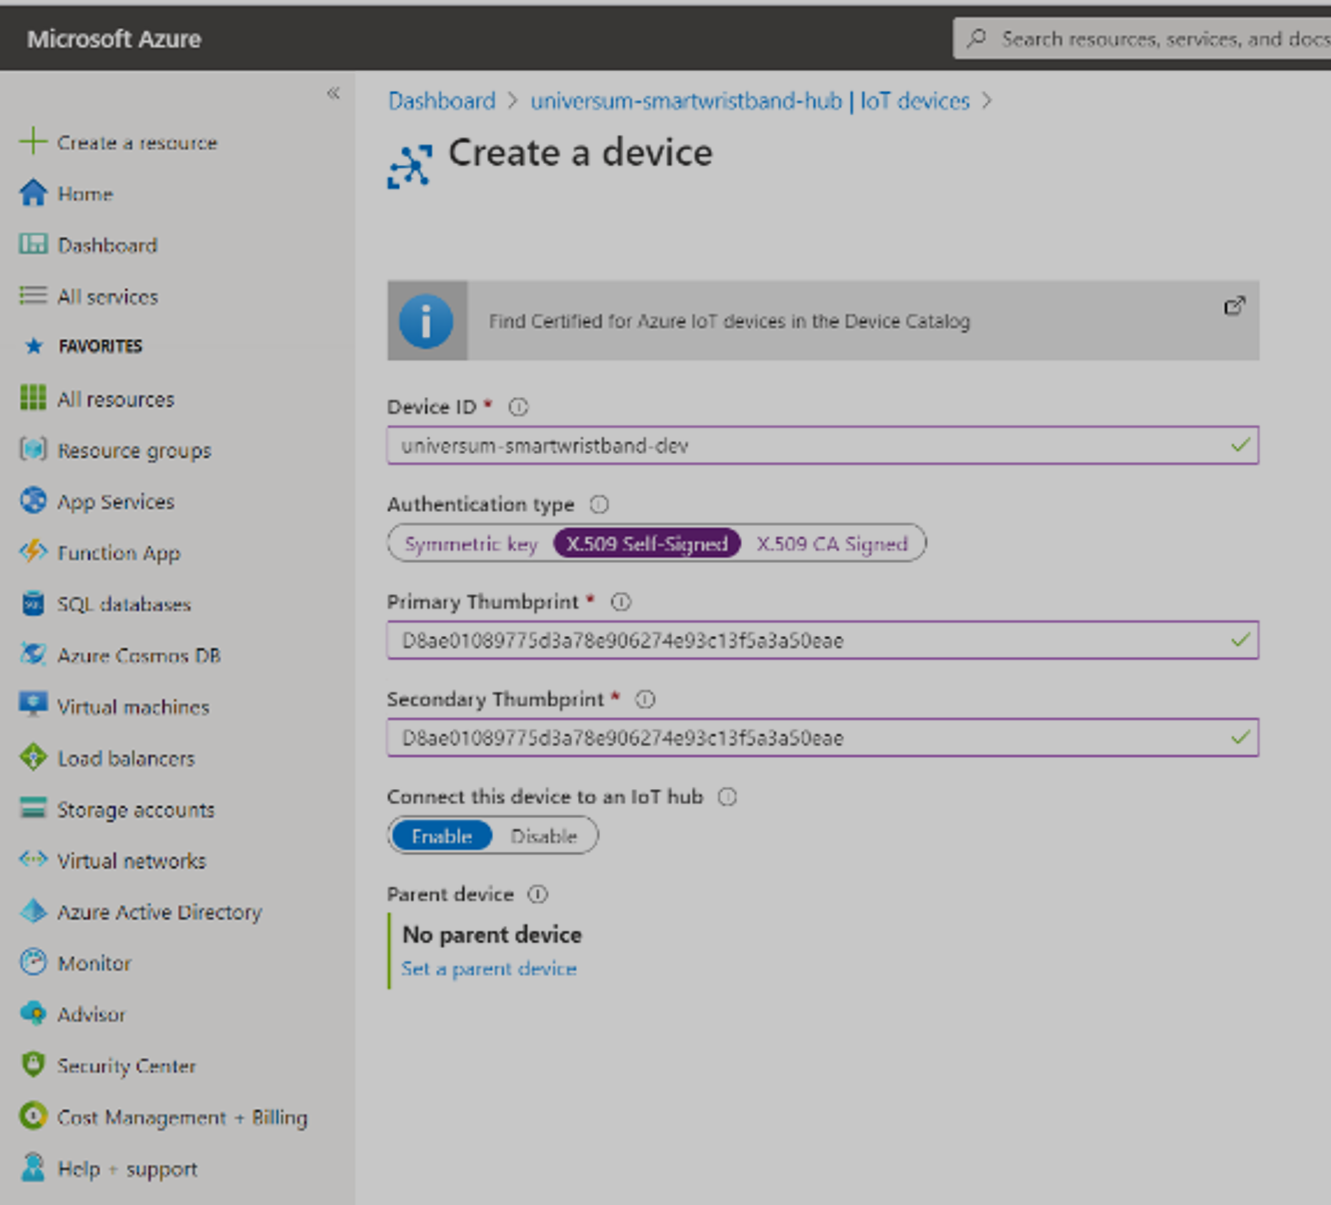
Figure 12: A screenshot of the device tab in IoT Hub
Make sure you replace the Primary Thumbprint and the Secondary Thumbprint with your SHA1 value extracted in the second step of the project conduct.
- Click save and we are ready to go!
Step 5: Creating the Cosmos DB Database
Now we need to create the database where the data sent by our device will be stored. I am using Azure’s Cosmos DB as it is accustomed to storing JSON files which is what we are sending from the device.
- Firstly, navigate back to the Create a Resource button from the menu on the right and click it. Search for Cosmos DB and then select the option.
- Select the resource group created with the IoT Hub and give it a name, keep the rest of the settings the same. Do ensure that the region is the same on both the IoT hub and the database to prevent region transfer costs.
- And that’s it! Wait for the resource to deploy and then we are ready to move on!
Step 6: Creating the Streaming Analytics Job
So now that we have our IoT hub and database set up, we need to connect the two together so that the data inputted into our IoT Hub is streamed into the database as it is received.
- Start off by creating a new resource by typing Stream Analytics Job. Now select the resource group used up until now and ensure that the number of streaming units is set to 1. If delivering a high quantity of devices, you may want to consider creating more streaming units to handle the greater number of devices.
- Wait for the resource to deploy and then select it from the All Resources button on the menu on the left.
- Now that we are in the resource, select the Inputs button from the menu on the left to select our input. Click on Add Stream Input and then select IoT Hub from the list of options.
- Enter the name of your IoT hub and then select it from the menu shown. Do not change any other settings. Click Save. Now click on the Outputs option from the menu on the left of the screen and select the Cosmos DB option from the list provided.
- Name the output and then select the database from the options provided. Select Create New under Database and set the database name to SmartWristband and the container name to data. Leave the document ID empty. Now click Save.
- The final thing we need to do is click on Query from the options. We need to supply the service with code to route all the data from the IoT hub into the database. Copy and paste the code below into the space provided. The code will map all inputted values to outputs which will then be stored in a JSON format in the Cosmos DB.
SELECT

    time as time,

    id as name,

    geoLat as latitude,

    geoLng as longitude,

    isWorn as isWorn,

    heartrate as heartrate,

    temperature as temperature,

    battery as battery

INTO

    [universum-smartwristband-db]

FROM

    [universum-smartwristband-hub]
- After that is done, click on the Save Query button from the menu at the top of the screen and we are ready to go. Now all we need to do is click back on Overview from the menu on the left and then start the streaming by pressing the Start button.
Step 7: Libraries Required
All libraries used in this project are open source. Below is the list of all libraries used and the links to their GitHub repositories. Please make sure you download and install them before moving on.MKRGSM Library - https://github.com/arduino-libraries/MKRGSM
- RTCZero Library
- Arduino Bear SSL Library
- ArduinoECCX08 Library
- Arduino MQTT Client Library
- Arduino Low Power Library
- DFRobot Heartrate Library
Step 8: Preparing the Variables
Now we can focus on the frontend of the application. Open the code from the GitHub repo in the Arduino IDE or web IDE and follow along with the steps below to edit the variables in the document so that the MKR GSM will be able to connect to Azure IoT.
- The first thing we will need to do is navigate to the IoT hub created and copy the hostname shown. Now open the secrets.h file from the project and input the string into the SECRET_BROKER field.
- The next thing is getting the device name. This is simply the name given to the device in the IoT Hub. Copy the name displayed and then paste it in the SECRET_DEVICEID field in the secrets.h file. At the end, your file should look something like this.

Figure 13: Inserting the credentials in the Arduino sketch
- The last thing you need to do is change the DEVICE_ID. I included this feature so that all devices would have a specific ID when deployed. You can set the ID to the name of the patient or a string to be able to identify the devices and distinguish them.
Finally, I want to talk about the MODE option. When I created this project, I needed to have a way to easily test and troubleshoot the application before deploying it. The mode of the application solves this. There are two modes in which the application can be set:
- DEVELOP_TIME is the developing mode. Here, the device prints verbose to the serial (the device only works connected to the computer with the serial monitor on). The device also wakes up and collects data every 10 seconds.
- RELEASE_TIME is the release mode. Here, the application works as expected, it can work on the field without the need of a connection to a computer, it will also take samples every 5 minutes as opposed to 10 seconds.
We will toggle between these modes later, for now, leave it in DEVELOP_MODE.
Step 9: Flashing the Developer Version
Now that all the setup is done, we need to test the code out to ensure it is running in the DEVELOP_MODE. To do this, ensure that you follow all the steps above and then connect your device to your PC or mac via USB and then upload the sketch.
Open the serial monitor (ctrl/cmd-shift-m) and view the verbose. It will take a while to configure the first time, ensure that the data is being sent to the IoT Hub correctly. Then visit the IoT Hub and check the graphs to see if data was received. You are now ready to deploy the application! If you need help troubleshooting, you can contact me by the email provided below.
Step 10: Shipping the Release Version
To change to the release version, all you need to do is change the MODE definition in the secrets.h file to RELEASE_TIME. Now upload this code to the device, ensure the LiPo battery is connected and then unplug it from the computer.
You should see the onboard LED of the device flashing every 10 minutes indicating that a cycle is running. Check the IoT Hub and Cosmos DB database to ensure that the data is going through. Now you are ready to deploy the device!
Ensure you send some data to the backend before continuing as we will need this when creating the dashboard.
Step 11: Onto the Dashboard
In this section I will explain working with the data in the Power Bi dashboards and reports, I will not go over how to design the dashboard because this is up to personal preference but will link tutorials that show you how to do this in detail.
Doctor Dashboard
I will start with the doctor dashboard. Make sure you have Power Bi desktop installed on your PC. Mac users can use the Power Bi online version to create this report, everything is basically the same.
- Launch the application and click on the Get Data button. Now navigate to the Azure option and select Cosmos DB from the options.
- Now go to your Cosmos DB resource and copy the URI link and paste it in the field in Power Bi. Sign in if this is required.
- Now we need to go to the keys window in the Cosmos DB dashboard and copy the PRIMARY KEY and paste it into the Account Key field. Now navigate through the database and ensure that the data file is checked. Click load and then we are ready to go!
- Now that you are in the report, find the Transform data button from the menu at the top of the screen. Click it to get a table with data.
- Click on the button next to the title of the table and select the fields shown above. You should see your table expand.
- Now we need to change the data types of the rows. Identify the Data Type button from the menu at the top of the screen and change the values accordingly.
- Now click on Close and Apply and you will be brought back to the dashboard. Your dashboard should look something like this.

Figure 14: Screenshot illustrating the data points in the Power Bi report
- The next thing we will need to do is create measures to process data and convert it into different forms in the report. Open the Stream Analytics Script folder from the GitHub repo in Visual Studio code. I installed an extension called DAX for Power Bi to get context highlighting.
- There are a number of files which have to be edited specifically for the patient as they hold the patient’s information. The list of files that must be edited is below:
- Gender.dax
- Age.dax
- Address.dax
- Open these files in VS code and edit them there.
- Now we will create new measures in Power Bi using these files. To do so, open the Power Bi report and click on the New Measure button from the menu at the top of the screen.
- Copy and paste the first file’s content into the text bar. Ensure that the Format and Data Category are set accordingly (i.e. set the category of latitude data to latitude). Now repeat this step for all other files, creating a new measure for each.
- Now we are moving on to the fun part – designing the dashboard. Please look at the tutorials below to get an idea of how to create infographics and style the dashboard:
- Basic Power Bi
- Complete Guide to Power Bi
- Free Udemy Course on Power Bi
- Forecasting data (ML) in Power Bi (used on temperature, heart rate and battery level)
- Now after the dashboard is designed, we need to publish it on the web so that we can access it from anywhere, on any device. Note that the data in the report is automatically refreshed when the user opens it (there is also a refresh button).
- Click on the Publish button from the menu at the top of the screen and select My Workspace as the destination. Wait for the dashboard to upload.
- To continue working on this, open the Power Bi report in the browser. We will now be working on the dashboard that summarises all patients. To do this, click on the tile depicting the status of the patient to see a menu.
- From the menu, select the pin visual button and create a new dashboard. This visual will pin to the dashboard. Repeat this for the following cards:
- Name
- Status
- Temperature
- Heart Rate
- The doctor will be able to see a glimpse of all the patients being monitored on this dashboard.
- Finally, click on the temperature card in the dashboard and then on the menu button, select the Manage Alerts button to open a menu where you can set alerts for the visual. Configure this as below and repeat the step with heart rate (set the threshold to 100).
And that’s it, we now need to work on the patient dashboard.
Patient Dashboard
We will start this dashboard by copying the doctor dashboard as we will be using all the measures and data collected there but display it in a different way.
I kept all the data there but removed the forecasting for the temperature and heart rate sections (to prevent patients from worrying too much about it) and removed the location section (because the patient knows where they are).
I also developed a mobile version of this dashboard. To do so, navigate to the View menu and then select Mobile Layout. From there, we only need to drag and drop the existing tiles onto the mobile phone to create this layout.
After this is done, we will upload the dashboard online again as done before. This dashboard can be shared with the patient through the Power Bi app where they can get a mobile version of the application showing them all the information they need as well as an online view.
Step 12: Finally, the enclosure
So now that everything is done, we need to create an enclosure for the project, now ideally it would be 3D printed, but because I don’t have a 3D printer (I really need to get one), I cut pieces of plastic out and assembled them that way. I do though have a 3D design made for the enclosure of the prototype.
The device is quite big in this instance and a future and industrial version will obviously be reduced in size (I just didn’t want to solder all the components onto a PCB so I could reuse them in future projects).
And that’s it! The project is done!
Conclusion
SmartWristband is a compact wearable device which monitors a coronavirus patient’s temperature, heart rate and alerts authorities should they violate their lockdown requirements. The information can be viewed to both patients and doctors on a minimal dashboard powered by Microsoft Power Bi.
I was inspired by the Taiwanese government because of their smart tracking devices that ensure that people confirmed with the virus stay at home and abide by the rules of the quarantine. I felt like this system could be improved to further enhance the safety of the patient by also monitoring their heart rate and temperature while at home.
Coronavirus is a tricky problem to tackle and truly needs a lot of cooperation and devotion to overcome. I believe that this application is implementable at global level to help monitor the health of patients confirmed with weak forms of the virus allowing them to stay at home and liberate space in hospitals that can be assigned to more urgent cases.
The thing I enjoyed the most out of the making of this project was the dashboard, I really enjoyed designing it (I am a visual person). I encountered some problems connecting the Arduino MKR GSM to Azure IoT. This was because I set the expiry date of the device’s certificate to something like 2 minutes (took me a while to realise).
SmartWristband
- Comments(0)
- Likes(2)
- 0 USER VOTES
- YOUR VOTE 0.00 0.00
- 1
- 2
- 3
- 4
- 5
- 6
- 7
- 8
- 9
- 10
- 1
- 2
- 3
- 4
- 5
- 6
- 7
- 8
- 9
- 10
- 1
- 2
- 3
- 4
- 5
- 6
- 7
- 8
- 9
- 10
- 1
- 2
- 3
- 4
- 5
- 6
- 7
- 8
- 9
- 10
 More by Andrei Florian
-
 PhoneLocator
AbstractFigure 1: PhoneLocator’s instant responseHave you ever forgotten your phone in your friend's...
-
 SmartWristband
Abstract Figure 1: The SmartWristband device being worn Monitor patients sent to self-isolate with t...
-
 Senso (Identification of Ilegal Logging)
AbstractFigure 1: The Senso device attached to a treePeople are always told to recycle and turn off ...
-
 SmartWay (Geolocation Monitoring)
AbstractFigure 1: The SmartWay device attached to the child's bag is glowing orange (meaning they ha...
-
 FlowerPot Monitor
Abstract Growing and maintaining a flower or plant can be difficult. It takes time, dedication and c...
-
 Monitemp (Monitor Temperature And Humidity)
AbstractFigure 1: A Monitemp device Not everyone has a thermostat in their home, and even if they do...
-
 SmartPostBox
AbstractFigure 1: Post box powered by SmartPostBox Figure 1: Post box powered by SmartPostBox SmartP...
-
 MyPulse (Heart Rate and SpO2 Sensor)
Abstract Now-a-days so many of us wear an array of sensors on our wrist all the time, keeping track ...
-
 CityGuide (Digital Tour Guide)
AbstractCityGuide is a digital tour guide application which allows people to sightsee throughout a c...
-
 IntlAir (Air Quality Monitoring and Automatic Purification)
Project Overview People spend most of their day at home, they wake up, go to work, then come back an...
-
 UnifiedWater
AbstractFigure 1: UnifiedWater device being held above canal Yearly, over 8 billion tonnes of plasti...
-
-
mammoth-3D SLM Voron Toolhead – Manual Drill & Tap Edition
175 0 0 -
-
AEL-2011 Power Supply Module
698 0 2 -
AEL-2011 50W Power Amplifier
592 0 2 -
-
-
Custom Mechanical Keyboard
788 0 0 -
Tester for Touch Screen Digitizer without using microcontroller
413 2 2 -
Audio reactive glow LED wristband/bracelet with NFC / RFID-Tags
377 0 1 -
-


