Heart rate sensor
Heart Rate
It is one of our vital signs and is defined as the number of times per minute that our heart beats or contracts.
The normal heart rate for an adult at rest is between 60-100 beats per minute.
Tachycardia refers to an increase in heart rate at rest, more than 100 beats per minute.
Bradycardia refers to a slow heart rate, usually less than 60 beats per minute.
Oximeter Operation
Through optical measurement, it uses a microprocessor with a pair of small light-emitting diodes (LED) focused on a photodiode that sends trains of impulses that pass through a translucent part of the patient's body, which can be a finger or a lobe of the ear. ear. One LED has a wavelength of 660 nm (red) and the other has a wavelength of 940 nm (infrared).
The absorption of light of these wavelengths differs significantly by oxygen-laden blood and oxygen-depleted blood:
Oxygenated hemoglobin absorbs more infrared radiation and allows more red light to pass through – 940 nm
Deoxygenated hemoglobin absorbs more red light and allows more infrared radiation – 660 nm – to pass through.

Creating our Oximetry curve and when determined by each peak for one minute we obtain our Heart Rate.

So now we are going to build our own Oximeter to determine our Heart Rate and our Blood Oxygen Saturation.
Necessary material
1 Arduino UNO
1 Red LED
1 Infrared LED 660nm
1 220Ω resistor
2 47KΩ Resistors
1 photo transistor
1 1uF electrolytic capacitor
1 10uF electrolytic capacitor
1 100Ω resistor
1 10KΩ Resistor
1 100KΩ Resistor
1 LM358P Operational Amplifier
22 gauge connection cables
1 Protoboard experimentation board
Code Description
The code is very simple to understand, since in the first instance we only declare our pin A0 as an input to read the signal from our oximeter.
In our “setup” our Serial communication at 9600 baud.
In the “loop” we declare that “signal” is equal to the analog reading received in the reading variable which is our A0 pin, then we print the value on our “Serial Plotter”.
Finally, we have an “if” with which we condition that our signal (signal) is greater than or equal to “700” (value obtained from observing the “maximum or peak” of the signal) this peak allows us to calculate the heart rate and the The action it performs is to turn on an LED on pin 9, and if we have a signal less than 699 then we keep the LED off, which will allow us to see our LED on every time we have a heart beat.
Recommendations
Use exactly the elements or materials that are proposed, otherwise you may have errors or your signal may not be seen.
Place the “finger” between the LED and the PHOTOTRANSISTOR, place it in a “Relaxed” manner (with support on the same palm).
Press the PHOTOTRANSISTOR a little with the “Finger Light” to obtain a better signal.
Results
We observe our signal on the “Serial Plotter” and it is very similar to the signal in our bibliography.

Once we determine the “maximum or peak” of our signal, in this case it was 700, we observe that our LED turns on and off depending on our pulse.
int lectura=A0; int senal=0; void setup(){ Serial.begin(9600); pinMode(lectura,INPUT); } void loop(){ senal=analogRead(lectura); Serial.println(senal); if(senal >= 700){ digitalWrite(9,HIGH); } if(senal <= 699){ digitalWrite(9,LOW); } delay(30); }

Heart rate sensor
*PCBWay community is a sharing platform. We are not responsible for any design issues and parameter issues (board thickness, surface finish, etc.) you choose.

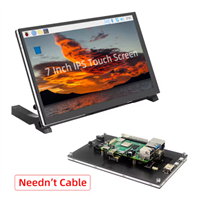
Raspberry Pi 5 7 Inch Touch Screen IPS 1024x600 HD LCD HDMI-compatible Display for RPI 4B 3B+ OPI 5 AIDA64 PC Secondary Screen(Without Speaker)
BUY NOW
ESP32-S3 4.3inch Capacitive Touch Display Development Board, 800×480, 5-point Touch, 32-bit LX7 Dual-core Processor
BUY NOW
Raspberry Pi 5 7 Inch Touch Screen IPS 1024x600 HD LCD HDMI-compatible Display for RPI 4B 3B+ OPI 5 AIDA64 PC Secondary Screen(Without Speaker)
BUY NOW- Comments(0)
- Likes(2)
 Log in to post comments.
-
 Anthony Pedotto
Feb 22,2025
-
 Engineer
Jan 04,2024
- 0 USER VOTES
- YOUR VOTE 0.00 0.00
- 1
- 2
- 3
- 4
- 5
- 6
- 7
- 8
- 9
- 10
- 1
- 2
- 3
- 4
- 5
- 6
- 7
- 8
- 9
- 10
- 1
- 2
- 3
- 4
- 5
- 6
- 7
- 8
- 9
- 10
- 1
- 2
- 3
- 4
- 5
- 6
- 7
- 8
- 9
- 10
 More by Cool Projects
-
-
Commodore 64 1541-II 1581 Floppy Disk Drive C64 Power Supply Unit USB-C 5V 12V DIN connector 5.25
239 1 3 -
Easy to print simple stacking organizer with drawers
101 0 0 -
-
-
-
-
-
-
Modifying a Hotplate to a Reflow Solder Station
1180 1 6 -
MPL3115A2 Barometric Pressure, Altitude, and Temperature Sensor
666 0 1 -


