|
604-WP56BID LEDs PTH Red Blinking LED 625nm, 40 mcdKingbright
|
x 1 | |

|
Resistor 220 0603YAGEO
|
x 1 | |

|
Header Male |
x 1 | |

|
A000066Arduino
|
x 1 | |

|
NodeMCU-32S Lua WiFi IoT Development Board |
x 1 |

|
arduino IDEArduino
|
|

|
ESP-PROGEspressif
|
Diy Error Indication Led Board
How to Debug Your Arduino Project
Anyone who’s written code in the past can tell you that it usually doesn't work as initially expected. In fact, when it comes to writing code, debugging is an essential part of the creative process. However, Arduino debugging can be a little more complicated. One of the reasons for that is that Arduino doesn’t come with a custom debugging tool.
Start Your Circuit >>
Most programs will use a debugger to help the programmer locate bugs and address them. Yet Arduino has no such debugging system. Arduino Debugging is one of the more challenging tasks of managing an Arduino project. Unlike most other IDEs, there is no official Arduino debugging feature onboard the Arduino IDE. Many users are surprised at the absence of a dedicated Arduino debugging tool.
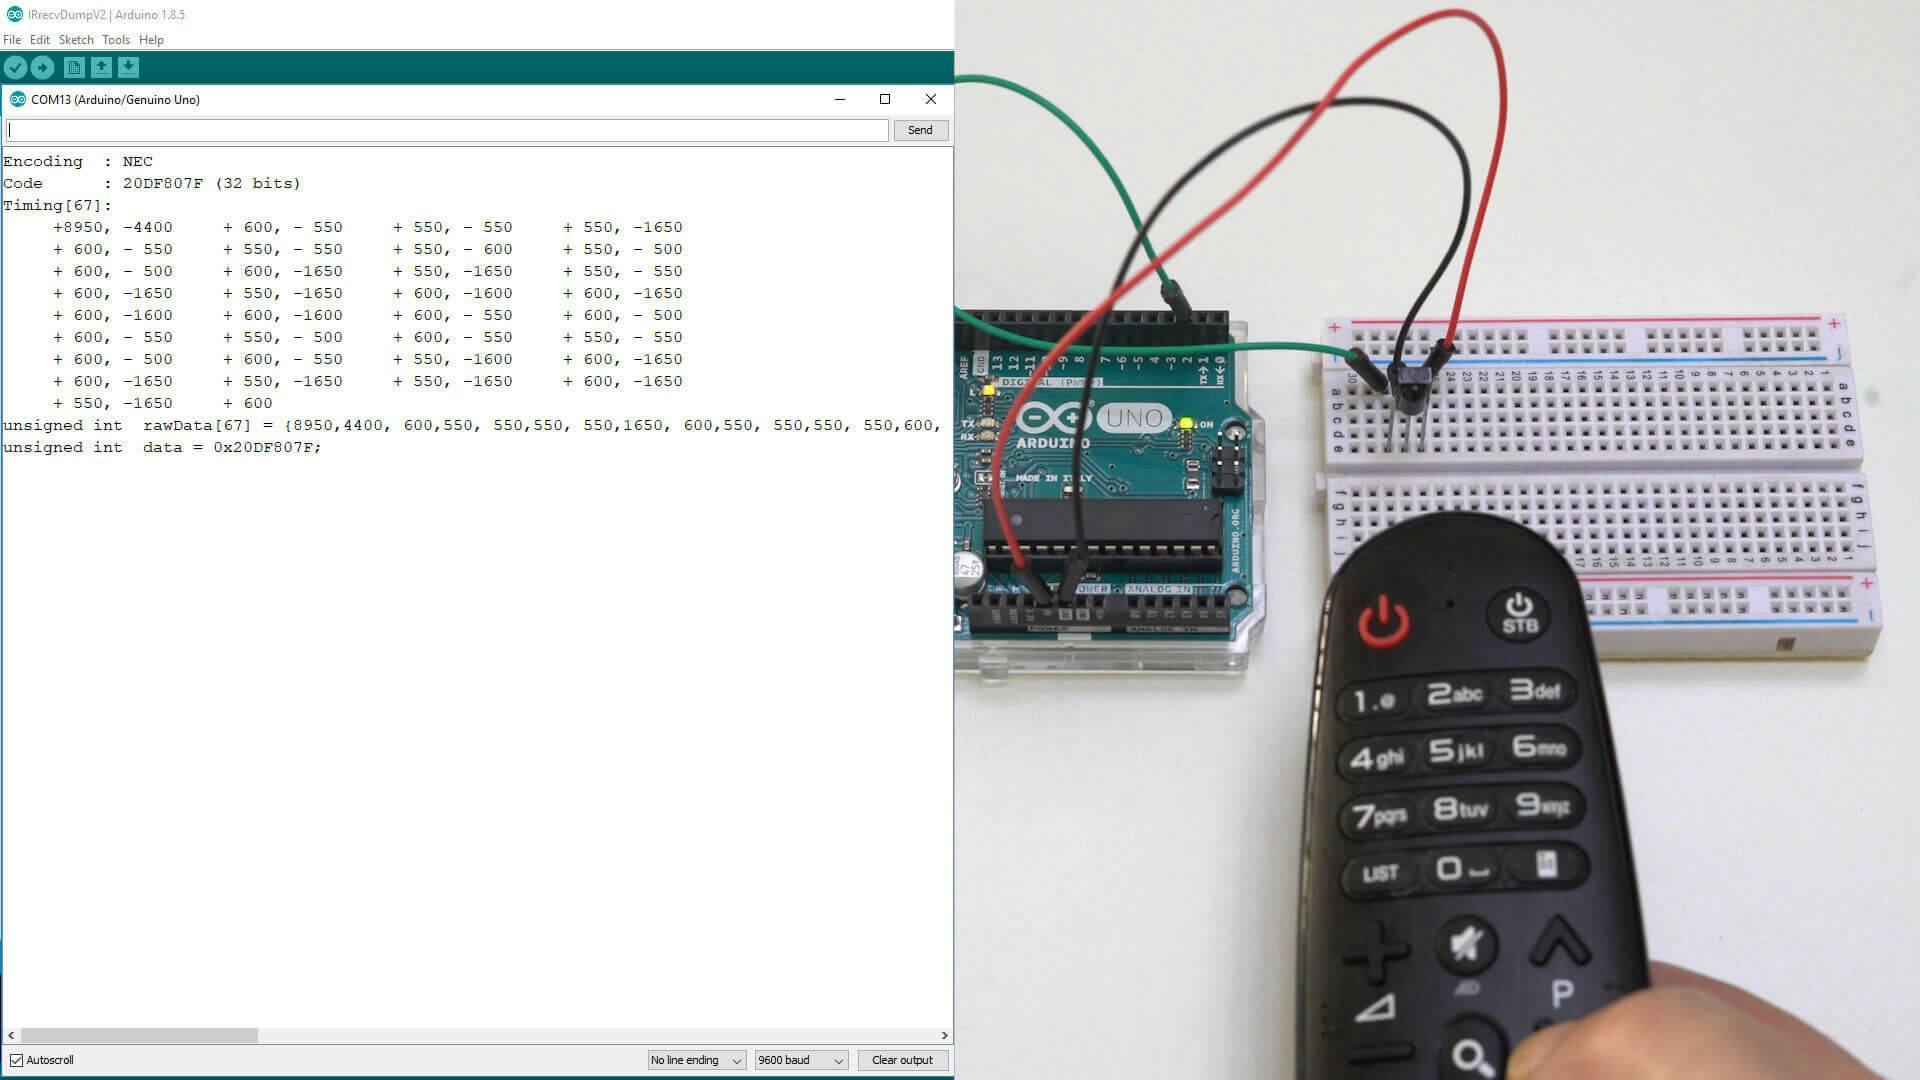
On Arduino, once you run your program you are unable to see what’s happening inside your device and how your code is running. The only assistance you’re given comes in the form of messages on your serial monitor or by LED display. Especially when other IDEs usually have debugging tools that utilize breakpoints, steps, call stack, watch, local/global variables and other components to double check through code.
However, debugging Arduino code isn’t the same as debugging code on a PC. The two are very different in terms of how they are approached. The main reason for this is that Arduino code is usually used to control physical outputs or receiving physicals inputs to/from the real world and the debugging process has to take those into account.

In practice, this means that Arduino developers often have to explore alternative methods and tools to debug their code. In this post, we’ll break down everything from Arduino code debugging to using a simulator to debug Arduino. This will give you all the information you need to produce code that works.
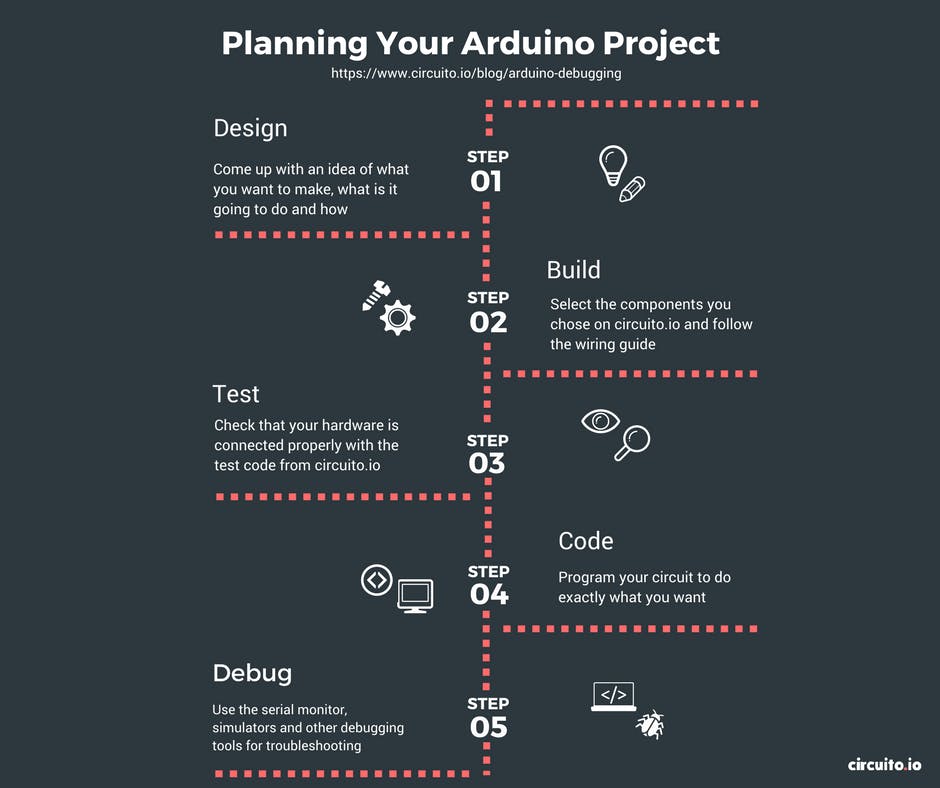
Design
When it comes to creating an Arduino Project your project’s overall design is very important. From the moment you start choosing components for your project, you need to have a clear idea of your end product in mind.
For example, if you want to design a sketch that runs on an Arduino board and lights up LEDs, you need to provide the foundations within the design phase of your project. The overall design of your sketches and your circuits will determine how your finished project looks.
Build
In terms of building your project, this is where you actually give life to your circuit. The ‘build process’ is where the Arduino IDE compiles your C++ sketch into machine code which is then uploaded straight to your Arduino board.
Circuito.io Code
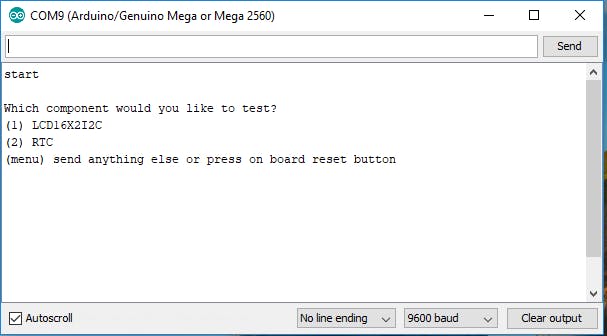
The code you get from circuito.io is actually a test code without any logic. This test code is used to check that all your components are wired properly and function correctly. This helps to check that there are no faults with your hardware setup. circuito.io also provides you with code libraries for all the different components you chose. If your test code fails, then you know you need to start the debugging process.
 Step 1: Check your hardware
As mentioned above, if your circuito.io code doesn’t work, chances are you have a problem with your hardware. This means you need to begin Hardware debugging.
Here are some basic troubleshooting steps for hardware issues:
Check wiring - One of the first things you should do when you wire your circuit is to check that you have connected everything correctly. If you’ve put the jumper wires in the wrong pin of the Arduino, or the wrong placement on the breadboard, your program will not be able to interact with the component. Double-check all the components and wires to make sure everything is securely in place. If you have a complex circuit, sometimes it’s just better to start from scratch, testing each component at a time to eliminate the problem.
Check Soldering - If some of your parts required soldering during setup, make sure that you soldered them properly. Poorly soldered parts are one of the most common causes of technical failure. If you can’t tell, resolder it.
Check Power Supply - If there’s still a problem with your circuit, you need to check the power supply. Using a multimeter, you can check 2 things:
Step 2: Code debugging
If your test code works, it’s time to write your own code. When writing your own Arduino code, there are a number of basic rules and best practices you should follow. By following the instructions below, you’ll have a much easier time if you need to debug it later on:
Write code in small chunks and test each of them.
Provide meaningful names for variables and functions
Use functions
Use constants rather than numbers
Write comments to explain coding choices for future reference
Make sure your code has a proper indentation and remains readable at all times. you can use Alt-t to auto-indent the whole sketch.
Compilation
If you get a compilation error when trying to compile or upload code to your board check for errors in syntax, typos and more. Using the correct syntax is vital for making sure your code compiles. When compilation fails, the IDE will present you with the errors on its bottom part. However, the error messages generated by the Arduino IDE are limited in their description and therefore not always very helpful.
If you understand what the error message means, try fixing the problem it indicates and compiles again. This is a convenient form of Arduino troubleshooting.
However, if you address an error listed on the IDE and the sketch still doesn’t compile, it’s a good idea to use Google to search for solutions to the problem.

Common syntax errors are:
missing ; at the end of each line
misplaced or missing parenthesis { }
undefined variables and functions
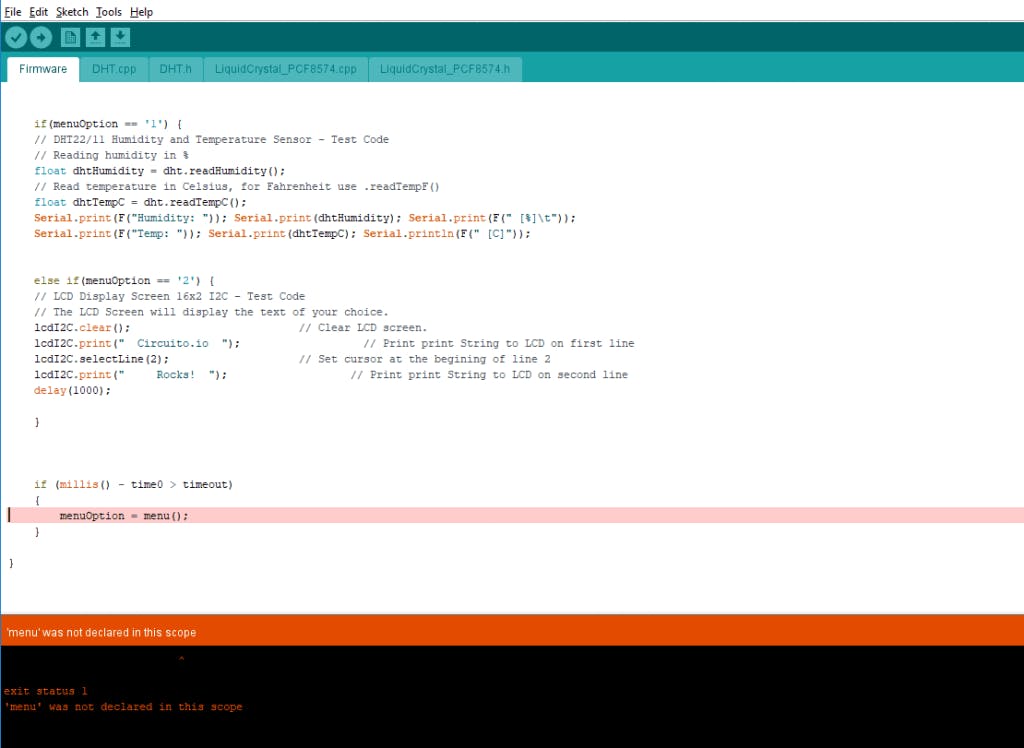 Arduino has a large open source community with extensive Arduino troubleshooting guides, which will help you to identify problems with your code. Once you’ve solved the problem and your code works, click run.
Run code
If your code compiles and uploaded successfully to the board but doesn’t run as expected you need to begin debugging.
Serial Monitor
As outlined above, if your code fails when you try to run your sketch, you need to start debugging your code. First, think and define which parameters to print and use the serial monitor to monitor them on screen(You can learn the basics of serial print here). The aim is to print an overview of the current state of the program. As such:
Variables
Inputs – sensor readings
Prints that indicate the programs flow, like inside an ‘if’ statement to see whether the condition was met
Outputs – e.g. PWM values before writing them to the pin
Anything else you find important to print to screen
Check Your Code Manually
One good way to assess the quality of your code and check for errors is by going through your code manually. You can do this by:
Writing your code from scratch and breaking it down to see if you made any mistakes along the way (Most commonly, these will be syntax errors).
Revisiting your design and asking what your main logic is. Write it down in words and then see if your code statements answer this question. Sometimes when we go deep into programming we make the mistake of focusing on the small details and missing the overall direction of the project. In this state, it’s easy to lose connection to the initial idea.
Go over your code and add comments (as much as needed) to explain to yourself what you are trying to do.
Step 3: Using external software Debugging tools
If you check your code manually and still can’t find the problem, it’s time to use an advanced debugging tool. Whereas many IDE’s have their own onboard debugging tool, Arduino doesn’t. However, there are a number of external tools you can use to make sure your code is running correctly. Here are some of the best tools to consider if you need advanced debugging and simulation options:
Visual Micro
Visual micro is a plugin available via Microsoft Visual Studio that is used to create cross-platform programs on Arduino. Any code created in Visual Micro that adheres to Arduino will be accepted. Visual Micro is great for collaborative teams debugging Arduino because it enables shared code and library editing. Code can be created across different platforms and combined with the program code throughout the build process. Visual Micro also offers GDB debugging and Serial, Bluetooth and Wifi debugging.
Atmel studio
Atmel Studio IDE is a free software that offers competitive debugging facilities to help resolve code errors. Through Atmel Studio, a project can be developed, compiled and uploaded to the relevant microprocessor. Like Arduino IDE, Atmel Studio’s IDE uses the same code, meaning that you don’t need to learn a new programming language in order to use it. Atmel is very versatile for the open source community and supports .ino sketches and C++ source codes. Atmel Studio also provides very good debugging capabilities using DebugWire or JTAG.
DebugWIRE
DebugWire is a protocol of Atmel to debug many ATTiny (e.g. ATTiny 13, 85) and ATmegas (e.g. ATmega48/88/168/328) without JTAG, only via the Reset pin. The DebugWire protocol is not documented by Atmel but some guys reverse engineered big parts of the protocol, and were able to build some simple debuggers. By using debugWIRE one has full read and write access to all memory and full control over the execution flow. It supports single-step, run-to-cursor, step-out, and software break instructions.
Step 4: Using Arduino simulators and emulators
More tools you can use for monitoring and debugging are Arduino emulators and simulators. Arduino simulators have made it easier than ever before for experts and hobbyists alike to program and test their ideas until they run efficiently. Hardware simulation is a complex process and while in the industry there are amazing tools for hardware debugging these tools are quite limited for makers and hobbyists.
However, simulators and emulators still have a place among the Arduino user’s debugging toolkit. Arduino simulators support line-to-line debugging which allows the user to look through their code and establish where they went wrong. Here are just a few advantages of using simulators:
Debugging
As mentioned above, simulators are great for debugging Arduino, both in terms of syntax and functional errors. What makes simulators suitable for debugging is that you can write code and create electronic circuits to test the integrity of your code. Some simulators will offer you a limited library of hardware to test whereas others will allow you to develop complex virtual environments. Today, you can even use simulators to render your project in 3D.
One of the biggest advantages provided by simulators is transparency. When running a simulation you can see exactly how your code works and identify ways it can be improved. This allows you to run new code without worrying about damaging your board or equipment.
Compared to IDE and hardware setups, simulators allow users to correct functional programming errors. Without a simulator, you can only address non-functional, technical mistakes in your code such as syntax errors. This makes simulators ideal for newer users who will need to undergo a lot of trial and error before they reach the finished product. Testing code via a simulator ensures that hardware stays operational, saving time and money.
Plotting and logging
Simulators not only allow you to test how your code runs, but allow you to log and plot the data generated as well. You can take note of your programming data and plot it on an external program like Excel. Logging data on your program and your additional devices helps to develop insights that can help refine your coding.

Experimentation
In terms of experimentation, simulators and emulators are hard to beat as well. Without a simulator, the user is confined to creating code based on their theoretical knowledge and has limited opportunities to try out new code and new components (especially when mistakes result in damaged hardware). With a simulator, you can test the code in a virtual environment and try out new ideas without worrying about the end result.
Testing new components
Likewise, simulators offer you a way to test out components before you pull the trigger and make a purchase. This way you can see if a part will be of use to your project, and practice integrating it into your overall environment. This ensures that you don’t waste money on buying parts that are of little to no use.
Create blueprints for electronic circuits
When constructing an electronic circuit, you can use a simulator to design, build and preview schematics. This cuts out much of the legwork of needing to manually draw up blueprints for electronic circuits saving you time. In addition, it also ensures that the end circuit design is adequately optimized.
Popular Simulator
1. Electronics Lab on Tinkercad (formerly circuits.io)
The Circuits.io platform makes it easy for users to simulate real-world electronics through a circuit simulator. This online simulator allows the user to drag in an Arduino board and start programming. It also offers the user a circuit diagram maker, multimeter measurement tool and oscilloscope. This Arduino simulator allows you to build your design from scratch whilst enabling you to take precise measurements of the power supply throughout your circuit.
2. Virtual Breadboard
Virtual Breadboard has established a name for itself as one of the most powerful and advanced Arduino simulators available today. Virtual Breadboard has grown within the electronic circuit industry and today can simulate Arduino devices, Netduino and PIC microcontrollers. On start up the user has access to a complete virtual development environment where they can program directly to an Arduino board. It’s also worth noting that it can act as an AVR emulator as well.
Debugging Arduino Doesn’t Need to be Difficult
When you start using Arduino, debugging can seem like a complicated process, but if you break it down into steps, you will probably be able to overcome the problems and learn a lot along the way.
As you saw in this guide, there are a variety of external tools to help you but the best way to debug is by trial and error, identifying faults along the way and fixing them as you go.
Another method that will help you cut down on the number of errors you encounter is to be strict with your syntax. This will ensure that when the time comes to debug your code you won’t have to sift through syntax errors which could have been eliminated during your write up.
Compared to an IDE with an onboard debugger, debugging an Arduino can be quite inconvenient. If you test, compile and run your code before putting it through a third party debugger, you’ll be well on track to producing quality code. Likewise, if you get lost along the way there’s a vibrant open-source community on hand to help.
Diy Error Indication Led Board
*PCBWay community is a sharing platform. We are not responsible for any design issues and parameter issues (board thickness, surface finish, etc.) you choose.
- Comments(0)
- Likes(0)
- 0 USER VOTES
- YOUR VOTE 0.00 0.00
- 1
- 2
- 3
- 4
- 5
- 6
- 7
- 8
- 9
- 10
- 1
- 2
- 3
- 4
- 5
- 6
- 7
- 8
- 9
- 10
- 1
- 2
- 3
- 4
- 5
- 6
- 7
- 8
- 9
- 10
- 1
- 2
- 3
- 4
- 5
- 6
- 7
- 8
- 9
- 10
 More by Sreeram.zeno
-
 Esp12-F Cluster V1.0
The ESP8266 is a low-cost Wi-Fi microchip, with built-in TCP/IP networking software, and microcontro...
-
 TB6612FNG Motor Driver
The TB6612FNG Motor Driver can control up to two DC motors at a constant current of 1.2A (3.2A peak)...
-
 Sunny Buddy Solar Charger v1.0
This is the Sunny Buddy, a maximum power point tracking (MPPT) solar charger for single-cell LiPo ba...
-
 Diy 74HC4051 8 Channel Mux Breakout Pcb
The 74HC4051; 74HCT4051 is a single-pole octal-throw analog switch (SP8T) suitable for use in analog...
-
 Diy RFM97CW Breakout Pcb
IntroductionLoRa? (standing for Long Range) is a LPWAN technology, characterized by a long range ass...
-
 ProMicro-RP2040 Pcb
The RP2040 is a 32-bit dual ARM Cortex-M0+ microcontroller integrated circuit by Raspberry Pi Founda...
-
 Serial Basic CH340G Pcb
A USB adapter is a type of protocol converter that is used for converting USB data signals to and fr...
-
 Mp3 Shield For Arduino
Hardware OverviewThe centerpiece of the MP3 Player Shield is a VS1053B Audio Codec IC. The VS1053B i...
-
 MRK CAN Shield Arduino
The CAN-BUS Shield provides your Arduino or Redboard with CAN-BUS capabilities and allows you to hac...
-
 AVR ISP Programmer
AVR is a family of microcontrollers developed since 1996 by Atmel, acquired by Microchip Technology ...
-
 Diy Arduino mega Pcb
The Arduino Mega 2560 is a microcontroller board based on the ATmega2560. It has 54 digital input/ou...
-
 Max3232 Breakout Board
MAX3232 IC is extensively used for serial communication in between Microcontroller and a computer fo...
-
 Line Follower Pcb
The Line Follower Array is a long board consisting of eight IR sensors that have been configured to ...
-
 HMC6343 Accelerometer Module
The HMC6343 is a solid-state compass module with tilt compensation from Honeywell. The HMC6343 has t...
-
 RTK2 GPS Module For Arduino
USBThe USB C connector makes it easy to connect the ZED-F9P to u-center for configuration and quick ...
-
 Arduino Explora Pcb
The Arduino Esplora is a microcontroller board derived from the Arduino Leonardo. The Esplora differ...
-
 Diy Stepper Motor Easy Driver
A motor controller is a device or group of devices that can coordinate in a predetermined manner the...
-
 Diy Arduino Pro Mini
The Arduino Pro Mini is a microcontroller board based on the ATmega168 . It has 14 digital input/out...
-
-
Instrumentation Input, high impedance with 16 bit 1MSPS ADC for SPI
233 0 0 -
RGB LED Matrix input module for the Framework Laptop 16
422 0 2 -
-
📦 StackBox: Modular MDF Storage Solution 📦
256 0 2 -
-


