|
Soldering iron |
|

|
Soldering Iron Wire Welding Lead Roll |
|

|
arduino IDEArduino
|
ESP8266 Air Quality monitor with Nova PM Sensor SDS011
This time I will show you how to make a device that monitors the quality of fine dust particles in the atmosphere. It measured both PM10 and PM2.5 particles uses the Nova PM SDS011 Laser Sensor. This sensor has a built-in fan which greatly simplifies construction and it has built-in logic-level serial communication providing direct readings of the PM2.5 and PM10 values without having to use maths to manipulate PWM values to obtain the results.
The sensor itself is delivered together with a USB to Serial converter, so we can connect it directly to the USB port of the PC. In that case, we need to use appropriate software that we can download from the sensor manufacturer's website (http://inovafitness.com/en/a/chanpinzhongxin/95.html).

The device that is presented this time works independently, so it is completely flexible in terms of installation location, size, as well as the cost of the entire device. The results are displayed on the 2.8 Inch TFT LCD Display, but also thanks to the use of the ESP8266 Wi-Fi module, is sent to a Windows PC running a small server application to log the data on a chart to be viewed on the application itself or in a web browser either on the PC or over the internet. So, the PC needs to have a static IP address set up in its Network Properties settings. One thing to note is that the sensor has a certain lifespan, and the datasheet claims “up to” 8,000 hours. If you run the sensor continuously that’s not quite a year, so you might want to think about how often you will power up the device. According to the code, the sensor is active for 30 seconds, while taking a reading, then shuts down completely for 4 minutes 30 seconds. The active period of the sensor is indicated by this Red LED. Instead to put the sensor into low power mode, here it is chosen to simple switch off the sensor's main power through a small Mosfet transistor. The code is taken from John Owen's blog (http://www.vwlowen.co.uk/arduino/Air-Quality/air-quality-monitor.htm) where you can find more detailed information. I just want to mention that in order to compile the code without errors, you need to install 2.7.4 ESP8266 arduino core version. This time we will not dwell on the way to install the ESP8266 Board definitions into the Arduino IDE, because it is explained in the previous videos.
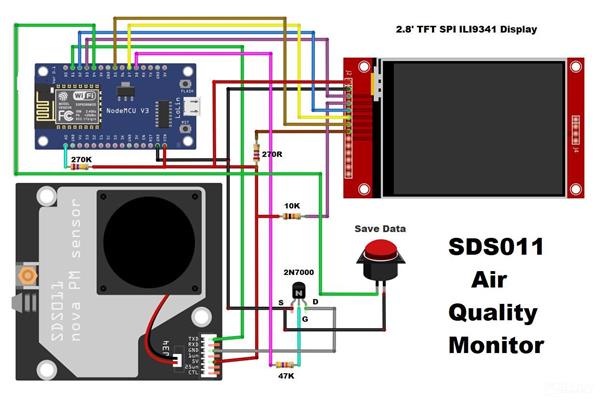
The hardware part of the device is relatively simple to make and consists of several components:
- ESP8266 based microcontroller board, in my case NodeMCU 1.0
- Nova PM SDS011 Laser based sensor
- 2.8 Inch TFT LCD Display with 240x320 dots resolution
- 2N7000 or similar Mosfet transistor
- Save data button
- and couple of resistors

If you want to make a PCB for this project, or for any other electronic project, PCBway is a great choice for you. PCBway is one of the most experienced PCB manufacturing company in China in field of PCB prototype and fabrication. They have a large online community where you can find a Open Source projects, and you can also share your project there. From my personal experience I can tell you that on this community you can find many useful projects with alredy designed PCBs, from where you can place an order directly.

The sensor is placed on the outer back of the case so that it can be maintained more easily, and also the results obtained are more accurate. When the device has to measure pollution outside, a suitable tube is placed leading to the external environment, so that the whole device is protected from negative influences.
When turning on the device, it first connects to the local Wi-Fi network with the appropriate username and password that we previously entered in the code. Data is sampled every 5 minutes so, as there are approximately 300 points across the display, the "histogram plot" represents approximately 24 hours of data. So, it needs to pass a certain time for the graph to start forming. The red LED signals when the Air pollution sensor is active.

The screen shows the concentration of PM2.5 and PM10 particles, as well as the strength of the Wi-Fi signal and the value of the supply voltage. Also in the lower right corner there is information when the sensor is active, and the time until its activation. As we see the color of the graph changes from light green, through yellow-red shades, to magenta, depending on the air pollution acciording to UK Defra scale.

We can also observe this graph on PC using the application "Air Quality Monitor" which you can download below. After installing the program, we need to make some simple settings:
First of all, as I mentioned before, we need to set the local IP address on PC Network adapter, that is previously defined in the code. In the system settings tab we also need to enter the port given earlier. Then in the chart settings we adjust the titles and shape of the graph, and finally in the Air Light tab we can graphically observe the concentration of PM particles during the day. Just to mention that the first results on the graph will appear after 24 hours.
Finally, the device is installed in a suitable box made of PVC boards with thicknesses of 3mm and 5mm and covered with self-adhesive colored wallpaper.
// SDS011 Air Quality Monitor
// --------------------------
// Optionally, used in conjunction with PC Server/plotter application at (c) vwlowen.co.uk
//
// Based on SDS011 Sensor libray by R. Zschiegner (rz@madavi.de).

#include <SDS011.h>                           //  https://platformio.org/lib/show/1563/SDS011%20sensor%20Library

#include <Adafruit_GFX.h>                     //  https://github.com/adafruit/Adafruit-GFX-Library
#include "Adafruit_ILI9341.h"                 //  https://github.com/adafruit/Adafruit_ILI9341
#include <Fonts/FreeSansBold18pt7b.h  >
#include <SPI.h>

#include <ESP8266WiFi.h>
#include <ESP8266HTTPClient.h>

#include <EEPROM.h>


const char* ssid = "abcdefg";             // Your WiFi SSID.
const char* password = "*****";           // Your WiFi Password.

String serverIP = "192.168.1.3:8802";          // The server IP address and Port number set up in the PC Server/plotter Application.
String deviceId = "air_quality";               // The device ID that the PC server Application will recognize.


//#define TFT_RST                // (Not connected. Pull TFT RST HIGH with 10k resistor)
//#define TFT_SCLK  D5           // SCLK is explicit and must be connected to D5 (GPIO14)
//#define TFT_MOSI  D7           //  MOSI is explicit and must be connected to D7 (GPIO13)

#define TFT_CS      D3           // GPIO0
#define TFT_DC      D2           // GPIO4

#define SAVE_COUNTER 12          // Data is saved to EEPROM every SAVE_COUNTER * SAMPLE_INTERVAL minutes. (1 hour).

#define SAMPLE_INTERVAL  5       // Take air sample every SAMPLE_INTERVAL minutes

#define SAMPLE_SECS  30          // Run fan for SAMPLE_SECONDS, then take air sample

#define SDS_TX       D1          // SDS011 Tx Pin  GPIO 5
#define SDS_RX       D6          // SDS011 Rx Pin  GPIO 12 (Unused IO - **Do Not Use**)

#define SDS011_PWR   D8          // Power control to SDS011 Sensor.
#define SAVE_DATA    D4          //

int loopCount = 0;

Adafruit_ILI9341 tft = Adafruit_ILI9341(TFT_CS, TFT_DC);  // Adafruit TFT library. Create an instance.

SDS011 sdsSensor;                                         // Sensor library - create an instance of the sensor.

String quality;                                           // Define PM2.5 value as LOW, MEDIUM etc (UK Defra scale).
int colour;                                               // Define PM2.5 value as colour (UK Defra scale)
short pm25Array[320];                                     // Array to hold sensor values for the histogram.

float p10, p25;                                           // Variabled for PM10 and MP2.5 data from sensor.
int error;                                                // Confirms valid data from sensor. 0 = error.

short arrayPointer = 15;                                  // Array element currently being written to (16-bit integer)
int yPos;                                                 // Vertical marker for bar chart.

int sleepSeconds;

float volts = 0.0;
const float Vmax = 5.75;                                 // Max voltage can be set here. Depends on resistor tolerances.

void saveData() {

  EEPROM.put(0, arrayPointer);

  for (int i= 15; i<=319; i++ ) {
     EEPROM.put(i*2, pm25Array[i]);
  }
  EEPROM.commit();

  tft.setCursor(245, 10);
  tft.setTextColor(ILI9341_BLUE, ILI9341_BLACK);
  tft.print("SAVED");
  while (digitalRead(SAVE_DATA) == LOW);
  delay(250);
}


void plotHistogram() {                                    // Function to re-draw the histogram.
   tft.fillRect(15,120, 319, 90, ILI9341_BLACK);          // Clear plotting area

   byte line;
   for (int i = 15; i <= 319;  i++){
      getTextData25(pm25Array[i] / 10);                   // Get colour corrsponding to each air quality level. Value is stored
                                                          // multiplied by 10 so divide by 10 here to get true value.
      line = constrain(sqrt(pm25Array[i]*40), 0, 105);    // Calculate length of line to plot. sqrt compresses higher values.
     tft.drawFastVLine(i, 225 - line, line,  colour);     // Draw vertical line in chosen colour.
   }
}


#define LIGHT_GREEN  0x9FF3                               // Define colours used by UK Defra to specify pollutant bands.
#define MID_GREEN    0x37E0
#define DARK_GREEN   0x3660
#define LIGHT_YELLOW 0xFFE0
#define MID_YELLOW   0xFE60
#define ORANGE       0xFCC0
#define LIGHT_RED    0xFB2C
#define MID_RED      0xF800
#define DARK_RED     0x9800
#define PURPLE       0xC99F


// UK air pollution bands for PM2.5 and PM10 Particles.
// https://uk-air.defra.gov.uk/air-pollution/daqi?view=more-info&pollutant=pm25#pollutant

int getTextData25(int value) {                                                         // Function sets three global variables: 'Ypos'
  switch (value) {                                                                     // (vertical cursor position), 'colour' &
    case 0 ... 11 : yPos = 100; colour = LIGHT_GREEN; quality = "1 LOW"; break;        // 'quality' and returns half the length of the
    case 12 ... 23 : yPos = 90; colour = MID_GREEN; quality = "2 LOW"; break;          // text string 'quality' whose value is used to
    case 24 ... 35 : yPos = 80; colour = DARK_GREEN; quality = "3 LOW"; break;         // centre justify the text on the display.
    case 36 ... 41 : yPos = 70; colour = LIGHT_YELLOW; quality = "4 MODERATE"; break;
    case 42 ... 47 : yPos = 60; colour = MID_YELLOW; quality = "5 MODERATE"; break;
    case 48 ... 53 : yPos = 50; colour = ORANGE; quality = "6 MODERATE";  break;
    case 54 ... 58 : yPos = 40; colour = LIGHT_RED;  quality = "7 HIGH"; break;
    case 59 ... 64 : yPos = 30; colour = MID_RED;  quality = "8 HIGH"; break;
    case 65 ... 70 : yPos = 20; colour = DARK_RED;  quality = "9 HIGH"; break;
    case 71 ... 9999: yPos = 10; colour = PURPLE;  quality = "10 VERY HIGH"; break;
    default: yPos = 10; colour = ILI9341_MAGENTA;  quality = "HAZARDOUS"; break;
  }
  return (quality.length() / 2) * 6;
}


int getTextDataPM10(int value) {
  switch (value) {
    case 0 ... 16 : colour = LIGHT_GREEN; quality = "1 LOW"; break;
    case 17 ... 33 : colour = MID_GREEN; quality = "2 LOW"; break;
    case 34 ... 50 :  colour = DARK_GREEN; quality = "3 LOW"; break;
    case 51 ... 58 : colour = LIGHT_YELLOW; quality = "4 MODERATE"; break;
    case 59 ... 66 : colour = MID_YELLOW; quality = "5 MODERATE"; break;
    case 67 ... 75 : colour = ORANGE; quality = "6 MODERATE";  break;
    case 76 ... 83 : colour = LIGHT_RED;  quality = "7 HIGH"; break;
    case 84 ... 91 : colour = MID_RED;  quality = "8 HIGH"; break;
    case 92 ... 100 : colour = DARK_RED;  quality = "9 HIGH"; break;
    case 101 ... 9999: colour = PURPLE;  quality = "10 VERY HIGH"; break;
    default: colour = ILI9341_MAGENTA;  quality = "HAZARDOUS"; break;
  }
   return (quality.length() / 2) * 6;
}


void setup() {

  pinMode(SDS011_PWR, OUTPUT);
  pinMode(SAVE_DATA, INPUT_PULLUP);
  pinMode(A0, INPUT);

  EEPROM.begin(1000);


  //-- The following block of code tests if the EEPROM has been 'prepared'  ----
  //-- with all zeroes and clears it if necessary.------------------------------

  bool eraseFlag = false;
  for (int i = 2; i< 30; i++ ) {
    if (EEPROM.read(i) != 0) {
      eraseFlag = true;
      break;
    }
  }

   if (eraseFlag) {
     for (int i=0; i< 640; i++){
       EEPROM.write(i, (byte) 0);                      // Reset EEPROM addresses to zero
     }
     EEPROM.put(0, (short) 15);                         // Reset array Pointer to start address (15)
     EEPROM.commit();
   }

 //-------------------------------------------------------------------------------


  EEPROM.get(0, arrayPointer);
  for (int i=15; i<319; i++) {
    EEPROM.get(i*2, pm25Array[i]);
  }

  tft.begin();

  tft.setRotation(1);
  tft.setTextWrap(true);

  tft.fillScreen(ILI9341_BLACK);
  tft.setTextSize(1);


  sleepSeconds = (SAMPLE_INTERVAL * 60) - SAMPLE_SECS;          // Calculate sleep time in seconds.

  WiFi.begin(ssid, password);                                   // Connect WiFi to server running on PC to
                                                                // plot PM10 and PM2.5 values.

  int wifi_timeout = 0;
  tft.setCursor(0, 10);
  tft.print("Connecting to WiFi...");
  while (WiFi.status() != WL_CONNECTED)  {
    delay(10);
    tft.setCursor(0, 20);
    tft.fillRect(0, 20, 100, 10, ILI9341_BLACK);
    tft.print(wifi_timeout);
    wifi_timeout++;
    if(wifi_timeout > 1000) {
      tft.setCursor(0, 35);
      tft.println("Failed to connect to Wifi");
      break;
    }
  }

  if (WiFi.status() == WL_CONNECTED) {
    tft.setCursor(0, 20);
    tft.print("Connected to ");
    tft.println(WiFi.SSID());
    tft.print("IP address: ");
    tft.println(WiFi.localIP());
    delay(5000);
  }

  tft.fillScreen(ILI9341_BLACK);

  tft.setCursor(15, tft.height() -20);

  tft.setTextSize(1);                                         // Print static labels and headers on display.
  tft.setCursor(150, 10);
  tft.println("PM 2.5");
  tft.setCursor(150, 17);
  tft.print("ug/m3");

  tft.setCursor(5, 10);
  tft.print("PM 10");
  tft.setCursor(5, 17);
  tft.print("ug/m3");

  tft.fillRect(312, 10, 6, 10, PURPLE);                        // Print a colour key for the Defra pollutant bands.
  tft.fillRect(312, 20, 6, 10, DARK_RED);
  tft.fillRect(312, 30, 6, 10, MID_RED);
  tft.fillRect(312, 40, 6, 10, LIGHT_RED);
  tft.fillRect(312, 50, 6, 10, ORANGE);
  tft.fillRect(312, 60, 6, 10, MID_YELLOW);
  tft.fillRect(312, 70, 6, 10, LIGHT_YELLOW);
  tft.fillRect(312, 80, 6, 10, DARK_GREEN);
  tft.fillRect(312, 90, 6, 10, MID_GREEN);
  tft.fillRect(312, 100, 6, 10, LIGHT_GREEN);

  tft.drawFastVLine(13, 120, 108, ILI9341_BLUE);               // Draw histogram vertical axis
  tft.setTextColor(ILI9341_BLUE);

  tft.setCursor(0, 120);
  tft.print(" ^");
  tft.setCursor(0, 130);
  tft.print("50");
  tft.setCursor(0, 170);
  tft.print("10");
  tft.setCursor(0, 200);
  tft.print(" 1");

  tft.drawFastHLine(12, tft.height() - 14, tft.width()-1, ILI9341_BLUE);     // Draw histogram horizontal axis

  for (int x = 319; x > 15; x-=12) {
     tft.drawFastVLine(x, 227, 3, ILI9341_BLUE);                             // Draw 1-hour ticks on horizontal axis.
  }
  tft.setTextColor(ILI9341_BLUE);
  tft.setCursor(105, 232);
  tft.print("Air Quality Monitor");

   int rssi = WiFi.RSSI();

   tft.setCursor(0,  232);
   tft.fillRect(0, 232, 50, 8, ILI9341_BLACK);
   tft.setTextSize(1);

   if (WiFi.status() == WL_CONNECTED) {
     tft.setTextColor(ILI9341_BLUE);
     tft.print("RSSI " + String(rssi) + " dB");
   } else {
     tft.setTextColor(ILI9341_RED);
     tft.print("No WiFi");
   }

  tft.setTextColor(ILI9341_GREEN);

  tft.setTextSize(3);

  Serial.begin(9600);
  sdsSensor.begin(SDS_TX, SDS_RX);    // Begin sensor and define Tx and Rx pins.

  plotHistogram();

}


void loop() {

  digitalWrite(SDS011_PWR, HIGH);                         // Turn on SDS011 Sensor power


  tft.setTextSize(1);                                     //
  tft.setCursor(248, 232);
  tft.setTextColor(ILI9341_GREEN, ILI9341_BLACK);
  tft.print("SAMPLING ");

  for (int i = SAMPLE_SECS; i>=0; i--) {                // Run fan for 30 seconds to ensure new air

    tft.setCursor(300,  232);
     if (i < 10) {
       tft.print("0");
     }
     tft.print(i);

     if (digitalRead(SAVE_DATA) == LOW) {
        saveData();
     }

     delay(1000);
  }

  int raw = 0;                                             // Get supply voltage. Useful when battery operated.
  for (byte i=0;i<10;i++) {
    raw += analogRead(A0);
    delay(10);
  }
  raw = raw / 10;
  float volts = (raw / 1023.0) * Vmax;


  tft.fillRect(248, 232, 70, 10, ILI9341_BLACK);

  tft.fillRect(85, 105, 65, 8, ILI9341_BLACK);

	error = sdsSensor.read(&p25,&p10);                   // Read PM2.5 and PM10 values from sensor.

	if (! error) {
   Serial.print("P2.5: ");
   Serial.println(p25);
	 Serial.print("P10:  ");
   Serial.println(p10);


   int x = getTextData25(p25);                                          // Function retuns (width of text)/2 so we can
                                                                        // centre-justify it on the display. It also sets
   tft.setTextColor(colour);                                            // the text colour appropriate to the PM2.5 value as
                                                                        // defined by the UK Defra documentation.

   tft.fillRect(305, 10, 5, 105, ILI9341_BLACK);                        // Clear old triangle
   tft.fillTriangle(305, yPos, 308, yPos+5, 305, yPos+10, colour);      // Plot new position of triangle on colour scale

   tft.fillRect(100, 40, 110, 8, ILI9341_BLACK);                        // Clear display areas where new text will
                                                                        // be drawn. (Graphical fonts don't overwrite
   tft.fillRect(0, 36, 285, 77, ILI9341_BLACK);                         // previous text.

   tft.setCursor(165 - x, 40);                                          // Set cursor to centre of display area.
   tft.print(quality);

   tft.setTextSize(2);
   tft.setFont(&FreeSansBold18pt7b);                                    // Change to new font.

   String sp25 = String(p25);                                           // Convert PM2.5 value to text because the
                                                                        // 'getTextBounds' function needs text.
   int16_t x1, y1;
   uint16_t w, h;
   tft.getTextBounds(sp25, 0,0, &x1, &y1, &w, &h);                      // We mainly want the width of the text that
                                                                        // we're about to print so we can centre-justify it.
   tft.setCursor(183-(w/2), 110);
   tft.print(p25, 1);

   tft.setFont();                                                       // Revert to standard font.
   tft.setTextSize(1);

   tft.setTextColor(colour, ILI9341_BLACK);                             // PM10 data is less-used so just print it
   tft.fillRect(0, 30, 100, 10, ILI9341_BLACK);                         // in the top left corner of the display.
   tft.setCursor(0, 40);
   tft.print(quality);
   tft.setTextSize(2);
   tft.fillRect(0, 55, 60, 20, ILI9341_BLACK);

   tft.setCursor(2, 55);
   tft.print(p10, 1);

   tft.setTextSize(1);
   tft.setTextColor(ILI9341_GREEN);
   tft.fillRect(80, 10, 50, 10, ILI9341_BLACK);
   tft.setCursor(80, 10);
   tft.print(volts);
   tft.print("v");

   tft.fillRect(245, 10, 30, 10, ILI9341_BLACK);


// ====== plot histogram (bar graph) ==============

   if (arrayPointer >= 319) {                              // If array has been filled, move all values down one.
     for (int i = 15; i <= 319; i++) {
       pm25Array[i] = pm25Array[i+1];
     }
   }

   pm25Array[arrayPointer] = (short) (p25 * 10);           // Multiply float value by 10 to make short integer.

   plotHistogram();

   if (arrayPointer < 319) arrayPointer++;                 // Increment the pointer to store the next value.


   delay(100);


 //======= end plot ====================


   int rssi = WiFi.RSSI();                                   // Get the WiFi signal strength and print on the display.

   tft.setCursor(0,  232);
   tft.fillRect(0, 232, 50, 8, ILI9341_BLACK);
   tft.setTextSize(1);

   if (WiFi.status() == WL_CONNECTED) {
     tft.setTextColor(ILI9341_BLUE);
     tft.print(" RSSI " + String(rssi) + " dB");
   } else {
     tft.setTextColor(ILI9341_RED);
     tft.print(" No WiFi");
   }


   if (WiFi.status() == WL_CONNECTED)  {
     HTTPClient http;

    // Specify request destination, including your GET variables

     String http_request = "";

     http_request = "http://" + serverIP  + "/apage?";      // Build the text string for the HTTP GET request to the PC server.
     http_request += "id=" + deviceId;
     http_request += "&leftaxis=" + sp25;
     http_request += "&rightaxis=" + String(p10);
     http_request += "&rssi=" + String(rssi);
     http_request += "&volts=" + String(volts);

     Serial.println("Making HTTP request...");
     Serial.println(http_request);

     http.begin(http_request);

    // Send the request
     int httpCode = http.GET();

    // Check the returning HTTP code
     if (httpCode > 0) {
      // Get a response back from the server
       String payload = http.getString();
      // Print the response
       Serial.println("HTTP Response: ");
       Serial.println(payload);
     }

    // Close the HTTP connection
      http.end();

    }
	}

	digitalWrite(SDS011_PWR, LOW);                        // Turn off SDS011 Power.

  delay(1000);
  tft.setTextSize(1);

  tft.setCursor(248, 232);
  tft.setTextColor(ILI9341_BLUE, ILI9341_BLACK);
  tft.print("SLEEP   ");

  int secs;
  int mins;

 for (int i = sleepSeconds; i>0; i--) {                 // Sleep for the sample interval (less the 30 seconds warmup time)
     tft.setCursor(285,  232);                          //
     secs = i;
     tft.print(secs / 60);                              // Print minutes remaining.
     tft.print(":");

     if (secs % 60 < 10) {
       tft.print("0");
     }
     tft.print(secs % 60);                              // Print seconds remaining.
     tft.print(" ");

     if (digitalRead(SAVE_DATA) == LOW) {               // Manually save histogram data to EEPROM - don't wait for the
        saveData();                                     // auto-save after one hour to expire.
     }

     delay(1000);
  }

  loopCount++;
  if (loopCount >= SAVE_COUNTER) {                      // Each loop takes 5 minutes. 12 loops = 5 * 12 = 60 minutes
    loopCount = 0;
    saveData();
  }

  Serial.print("Heap size at end of loop ");
  Serial.println(system_get_free_heap_size() );         // Free  memory check!


}
ESP8266 Air Quality monitor with Nova PM Sensor SDS011
- Comments(0)
- Likes(3)
-
 Xarl.li Arti
Oct 10,2024
-
 Engineer
Feb 03,2024
-
 Engineer
May 26,2023
- 0 USER VOTES
- YOUR VOTE 0.00 0.00
- 1
- 2
- 3
- 4
- 5
- 6
- 7
- 8
- 9
- 10
- 1
- 2
- 3
- 4
- 5
- 6
- 7
- 8
- 9
- 10
- 1
- 2
- 3
- 4
- 5
- 6
- 7
- 8
- 9
- 10
- 1
- 2
- 3
- 4
- 5
- 6
- 7
- 8
- 9
- 10
 More by Mirko Pavleski
-
 Arduino 3D Printed self Balancing Cube
Self-balancing devices are electronic devices that use sensors and motors to keep themselves balanc...
-
 How to make simple Variable HIGH VOLTAGE Power Supply
High Voltage Power Supply is usually understood as a device that is capable of generating a voltage...
-
 DIY 5-Day Rainfall Forecast Device - ESP32 E-Paper Project
In several of my previous projects I have presented ways to make weather stations, but this time I ...
-
 Build simple Retro Style VFO (Variable frequency oscillator) with Crowoanel 1.28 inch Round Display
Today I received a shipment with a Small round LCD display from Elecrow. The device is packed in tw...
-
 Human vs Robot – Rock Paper Scissors with MyCobot 280 M5Stack
Today I received a package containing the few Elephant Robotics products. The shipment is well pack...
-
 How to Build a Simple Audio Spectrum Analyzer with Adjustable Settings
An audio spectrum analyzer is an electronic device or software tool that measures and visually disp...
-
 How to Make a Digital Clock on a Vintage B&W TV using Arduino
These days I accidentally came across this small retro Black and White TV with a built-in Radio, so ...
-
 Build a $10 Function Generator with Frequency Meter for Your Lab
A function generator is a piece of electronic test equipment used to generate various types of elec...
-
 From Unboxing to Coding - Radar Clock on Elecrow’s 2.1 HMI Display
Today I received a shipment with a large round LCD display from Elecrow. The device is packed in two...
-
 Making a Retro Analog NTP Clock with Unihiker K10 - Arduino IDE Tutorial
Some time ago I presented you a way to use standard Arduino libraries on the Unihiker k10 developme...
-
 Build a Cheap & Easy HF Preselector - Antenna Tuner
HF antenna preselector is an electronic device connected between an HF radio antenna, and a radio r...
-
 DIY Static Charge Monitor - Electrostatic Field Detector (Arduino & TL071)
A Static Charge Monitor also known as a Static Field Meter or Electrostatic Voltmeter is a device u...
-
 XHDATA D-219 Radio Short Review with complete disassembly
Some time ago I received an offer from XHDATA to be one of the first test users of their new radio m...
-
 How to make Simplest ever Oscilloscope Clock
An oscilloscope clock is a unique and creative way to display the time using an oscilloscope, which...
-
 DIY Digital Barograph with BME280 and ESP32 - 24 Hour Pressure Trends
A barograph is a self-recording barometer that continuously measures and records atmospheric pressu...
-
 Build a Raspberry Pi Pico SDR Radio with Waterfall Display
Software-defined radio (SDR) is a radio communication system where components that have traditional...
-
 DIY Magnet Polarity Detector - How to Identify Poles with a Hall Sensor from a PC Fan
Recently, while working on a project, I needed to determine the polarity of several permanent magne...
-
 Light Meter Project - Making Dfrobot Unihiker K10 Work with Standard Arduino Libraries
The other day I received a shipment with a UNIHIKER K10 development board from DFRobot, which I rec...
-
-
AEL-2011 Power Supply Module
553 0 2 -
AEL-2011 50W Power Amplifier
512 0 2 -
-
-
Custom Mechanical Keyboard
710 0 0 -
Tester for Touch Screen Digitizer without using microcontroller
340 2 2 -
Audio reactive glow LED wristband/bracelet with NFC / RFID-Tags
322 0 1 -
-
-


